
Bridge Weigh in Motion (BWIM) systems allow heavy goods vehicles to be weighed, without stopping, as they pass over a bridge. The vehicle's speed, class and weight distribution are all logged without any disruption to traffic.
BWIM is a tool for gathering engineering data and business intelligence: it quantifies the bridge's economic value and the physical demands placed upon it. A bridge's structural integrity and its economic viability depend on the volume, and the type, of traffic it supports; yet predicting traffic is notoriously difficult. BWIM measurements let planners and engineers re-assess their assumptions, update their models and revise their economic and maintenance strategies. With BWIM, informed decisions can be made about the need for maintenance, its scheduling and its consequences.
As well as passively monitoring the bridge, a BWIM system can also be used actively to manage the flow of traffic. Vehicles can be categorised in real-time: traffic can be filtered and tolled according to their vehicle class. Overloaded vehicles can be denied access to subsequent bridges. BWIM can actively protect the bridge network and increase its profitability.
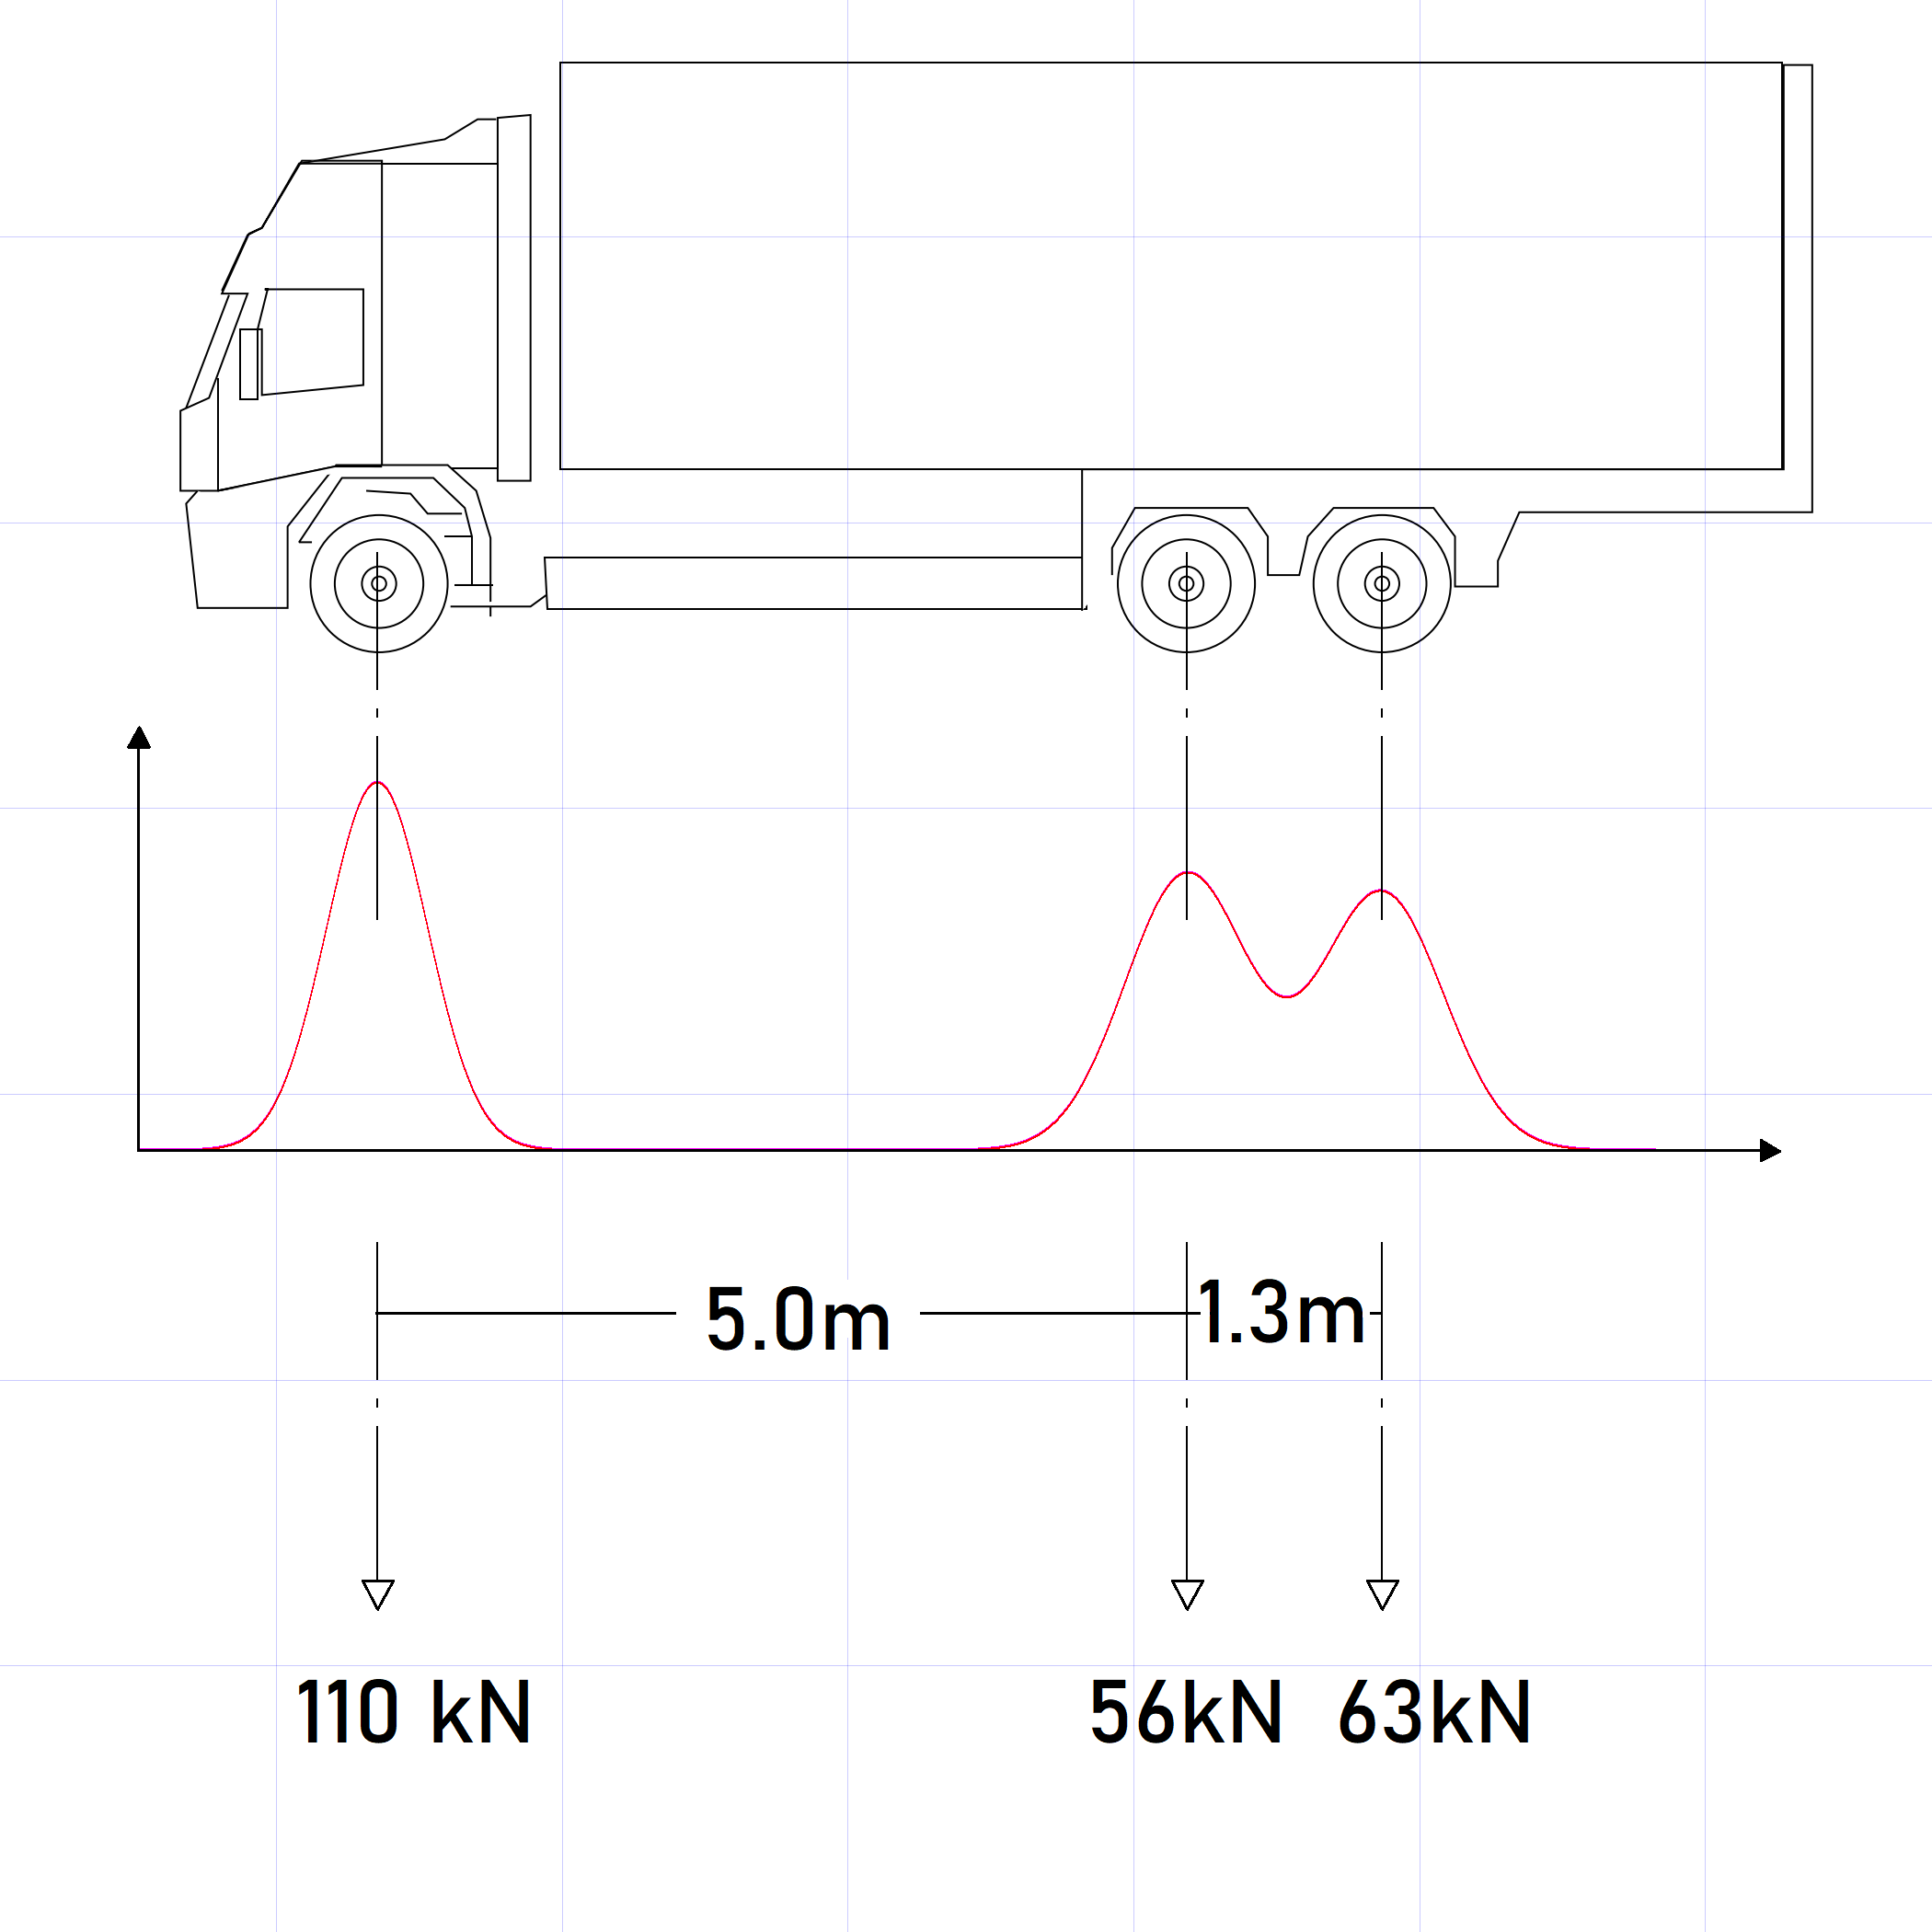
In practice, of course, BWIM systems confront several challanges. The measured signals are relatively weak yet must be robust to long term drift and temperature variations. In longer bridges, the stress imposed by an axle is less localised, and the responses to consecutive axles may merge. This makes it difficult to resolve the individual axles and estimate the weight distribution of the vehicle. The system may have to operate in a harsh environment location with little infrastructure. PSP's iBWIM system is based on a robust, high quality embedded system designed to perform accurate and precise measurements. Advanced signal processing techniques are used at the server to condition the measurements give the optimal interpretation.
BWIM systems have one clear advantage over conventional Weight in Motion (WIM) systems: they are easy to install. Traditional WIM systems measure vehicles using sensors embedded in the pavement. Installing the sensors requires lane closures which may last weeks. Furthermore, cutting into the pavement introduces stress concentrators that may actually initiate cracks and weaken the bridge structure. BWIM sensors, in contrast, are attached to the underside of the bridge. Traffic is undisturbed by the installation, attachment points do minimal damage to the bridge and no gantry is required.


PSP's iBWIM system is implemented in two parts: a robust, cluster of lightweight embedded systems on site; and a remote server that processes the measurements. The on-site systems monitor the sensors, perform pre-processing and pass the data to the remote server. An embedded system requires much less on-site infrastructure that a PC based system. In fact, because iBWIM can run from a battery and solar cell for several weeks, the only infrastructure required is mobile network coverage.
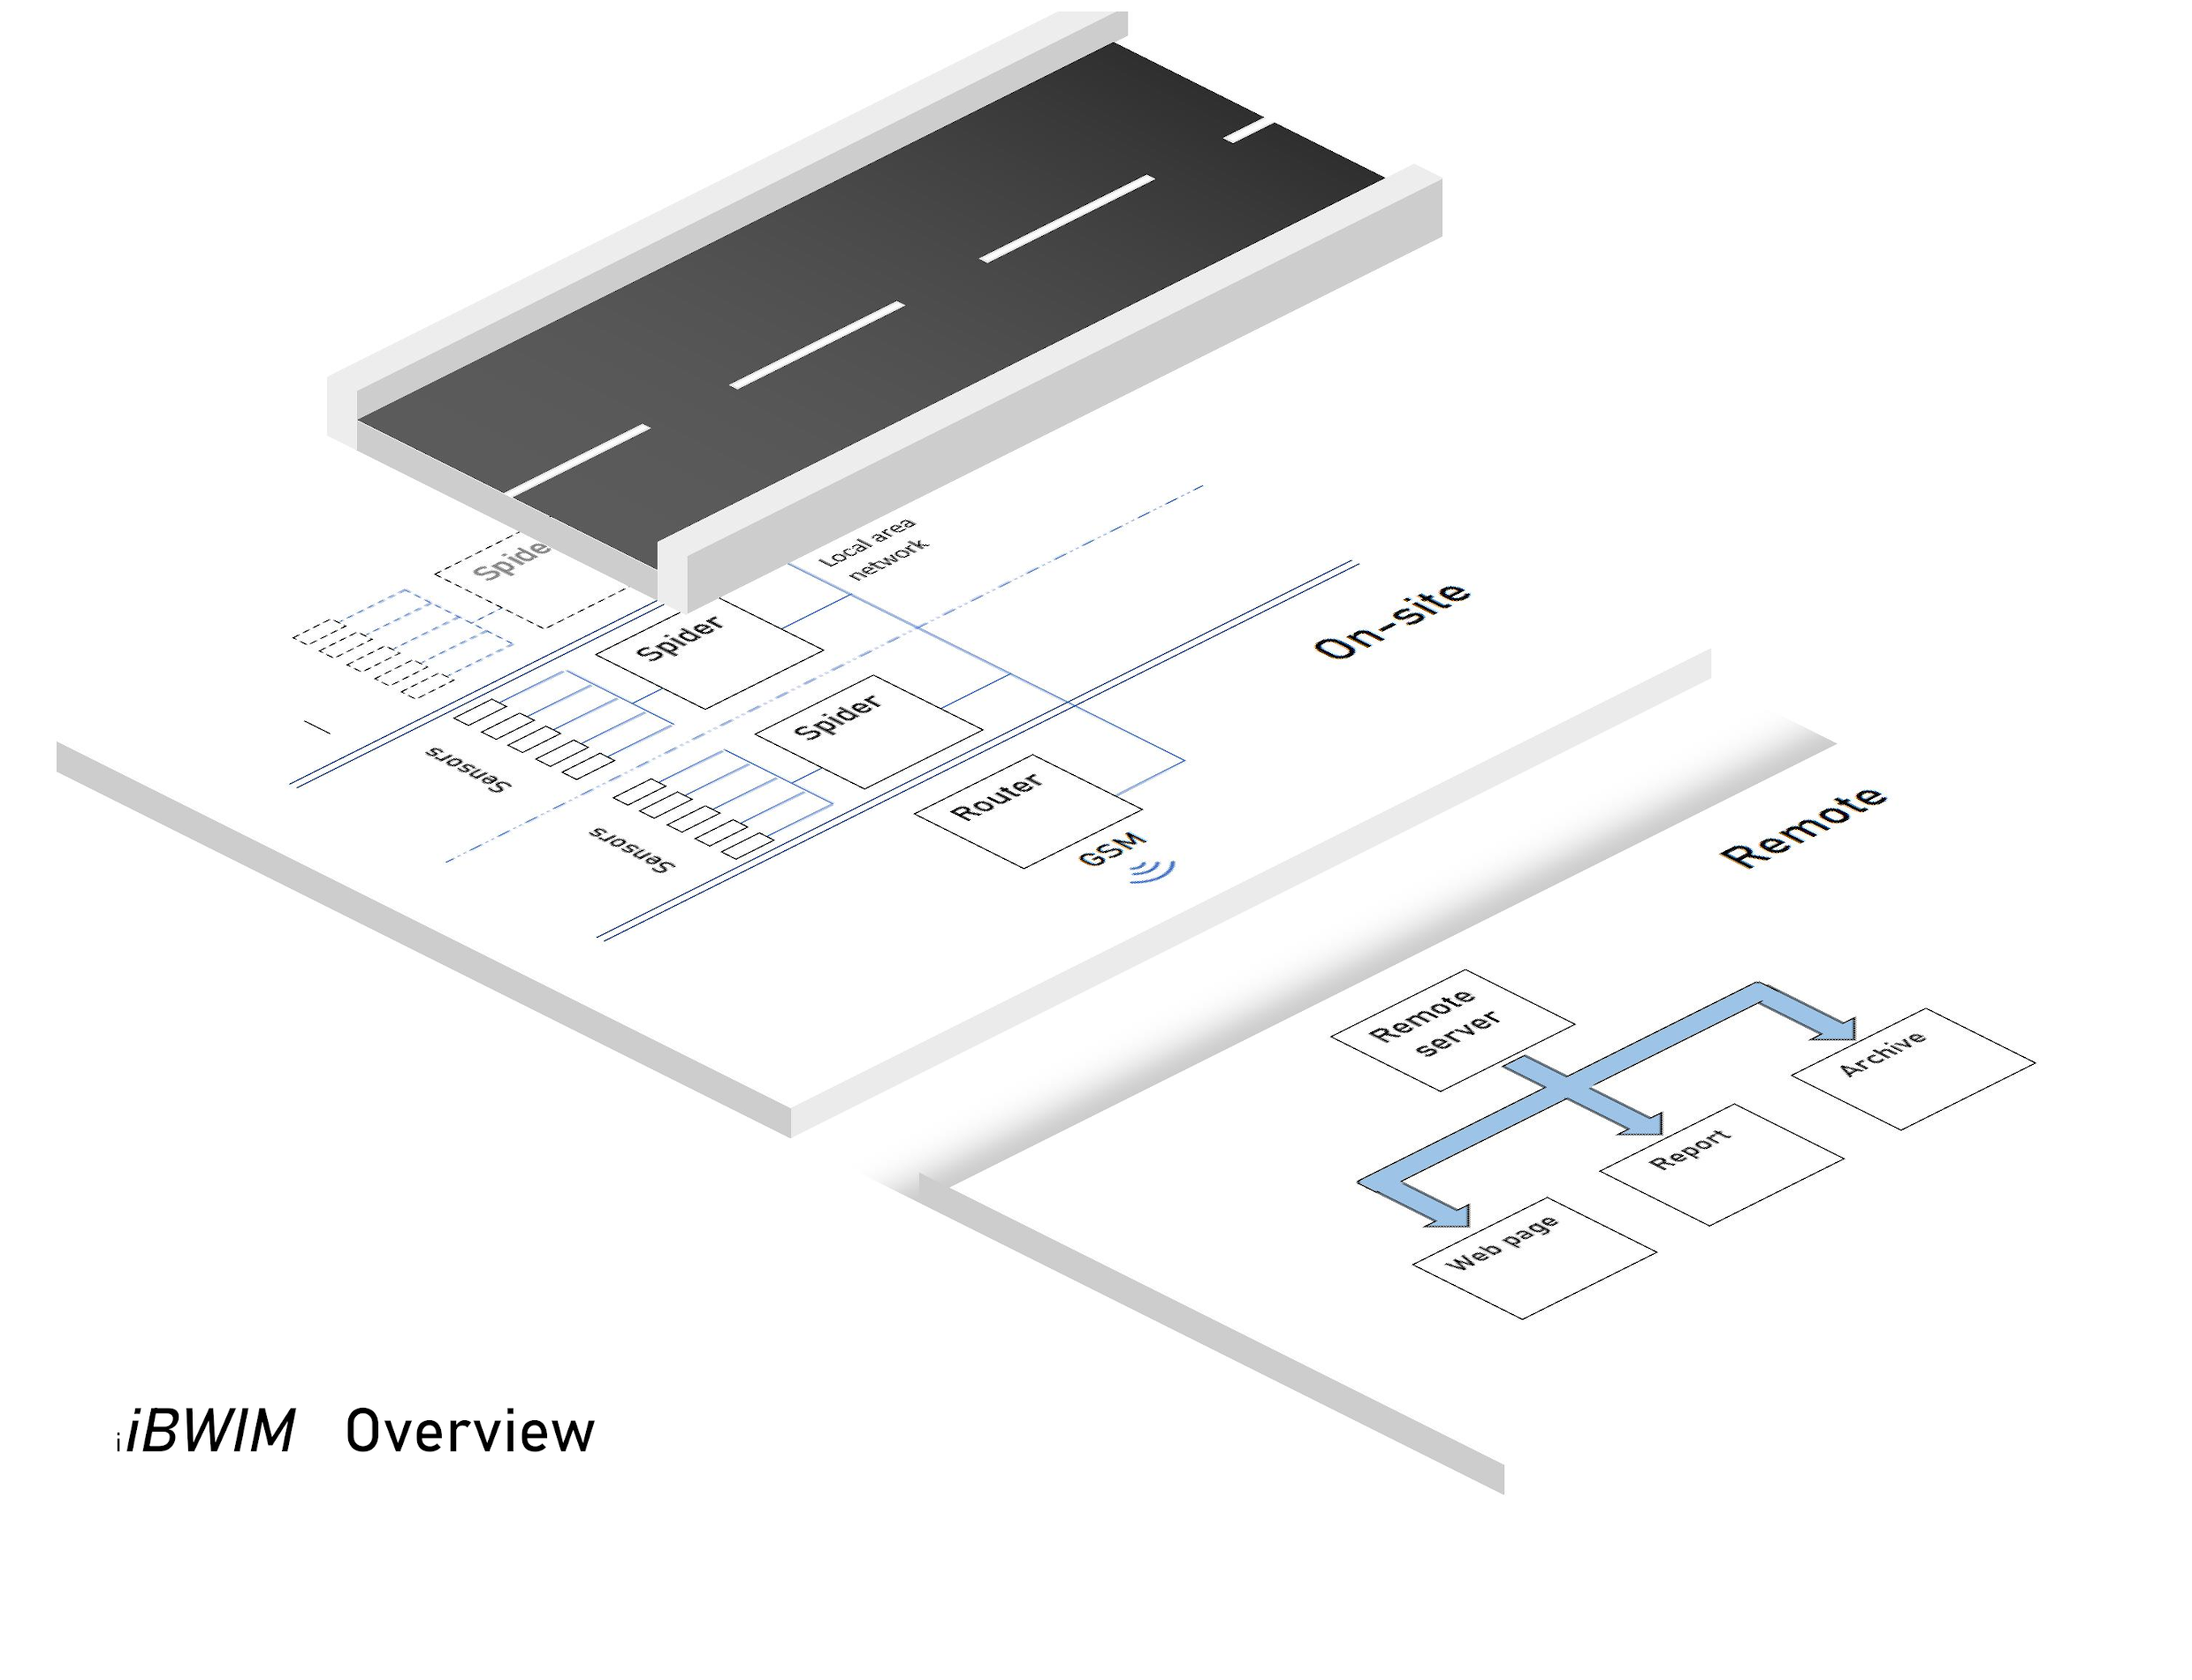
The embedded system, or Spider, was designed for flexibility and robustness: it can accept a wide range of sensors and cable runs of up to 150m have been used. Each Spider can monitor 8 voltage based sensors and has an additional 2 current loop channels. If more sensors are required, up to 4 groups of 4 Spider units can be chained together to form a Local Area Network. The on-site embedded system connects to the remote server over a GSM link.
The remote server performs the bulk of the signal processing and analysis. By placing the computational burden on the server we are able to make effective use of the computational power. We are therefore able to use complex, computationally intensive data analysis algorithms and to quickly and easily optimise their settings for a given bridge. The server also handles data presentation. The customer can access the data and compile statistics with a secure, easy to use web page. PDF reports that are tailored to the customer's requirements can be periodically compiled.
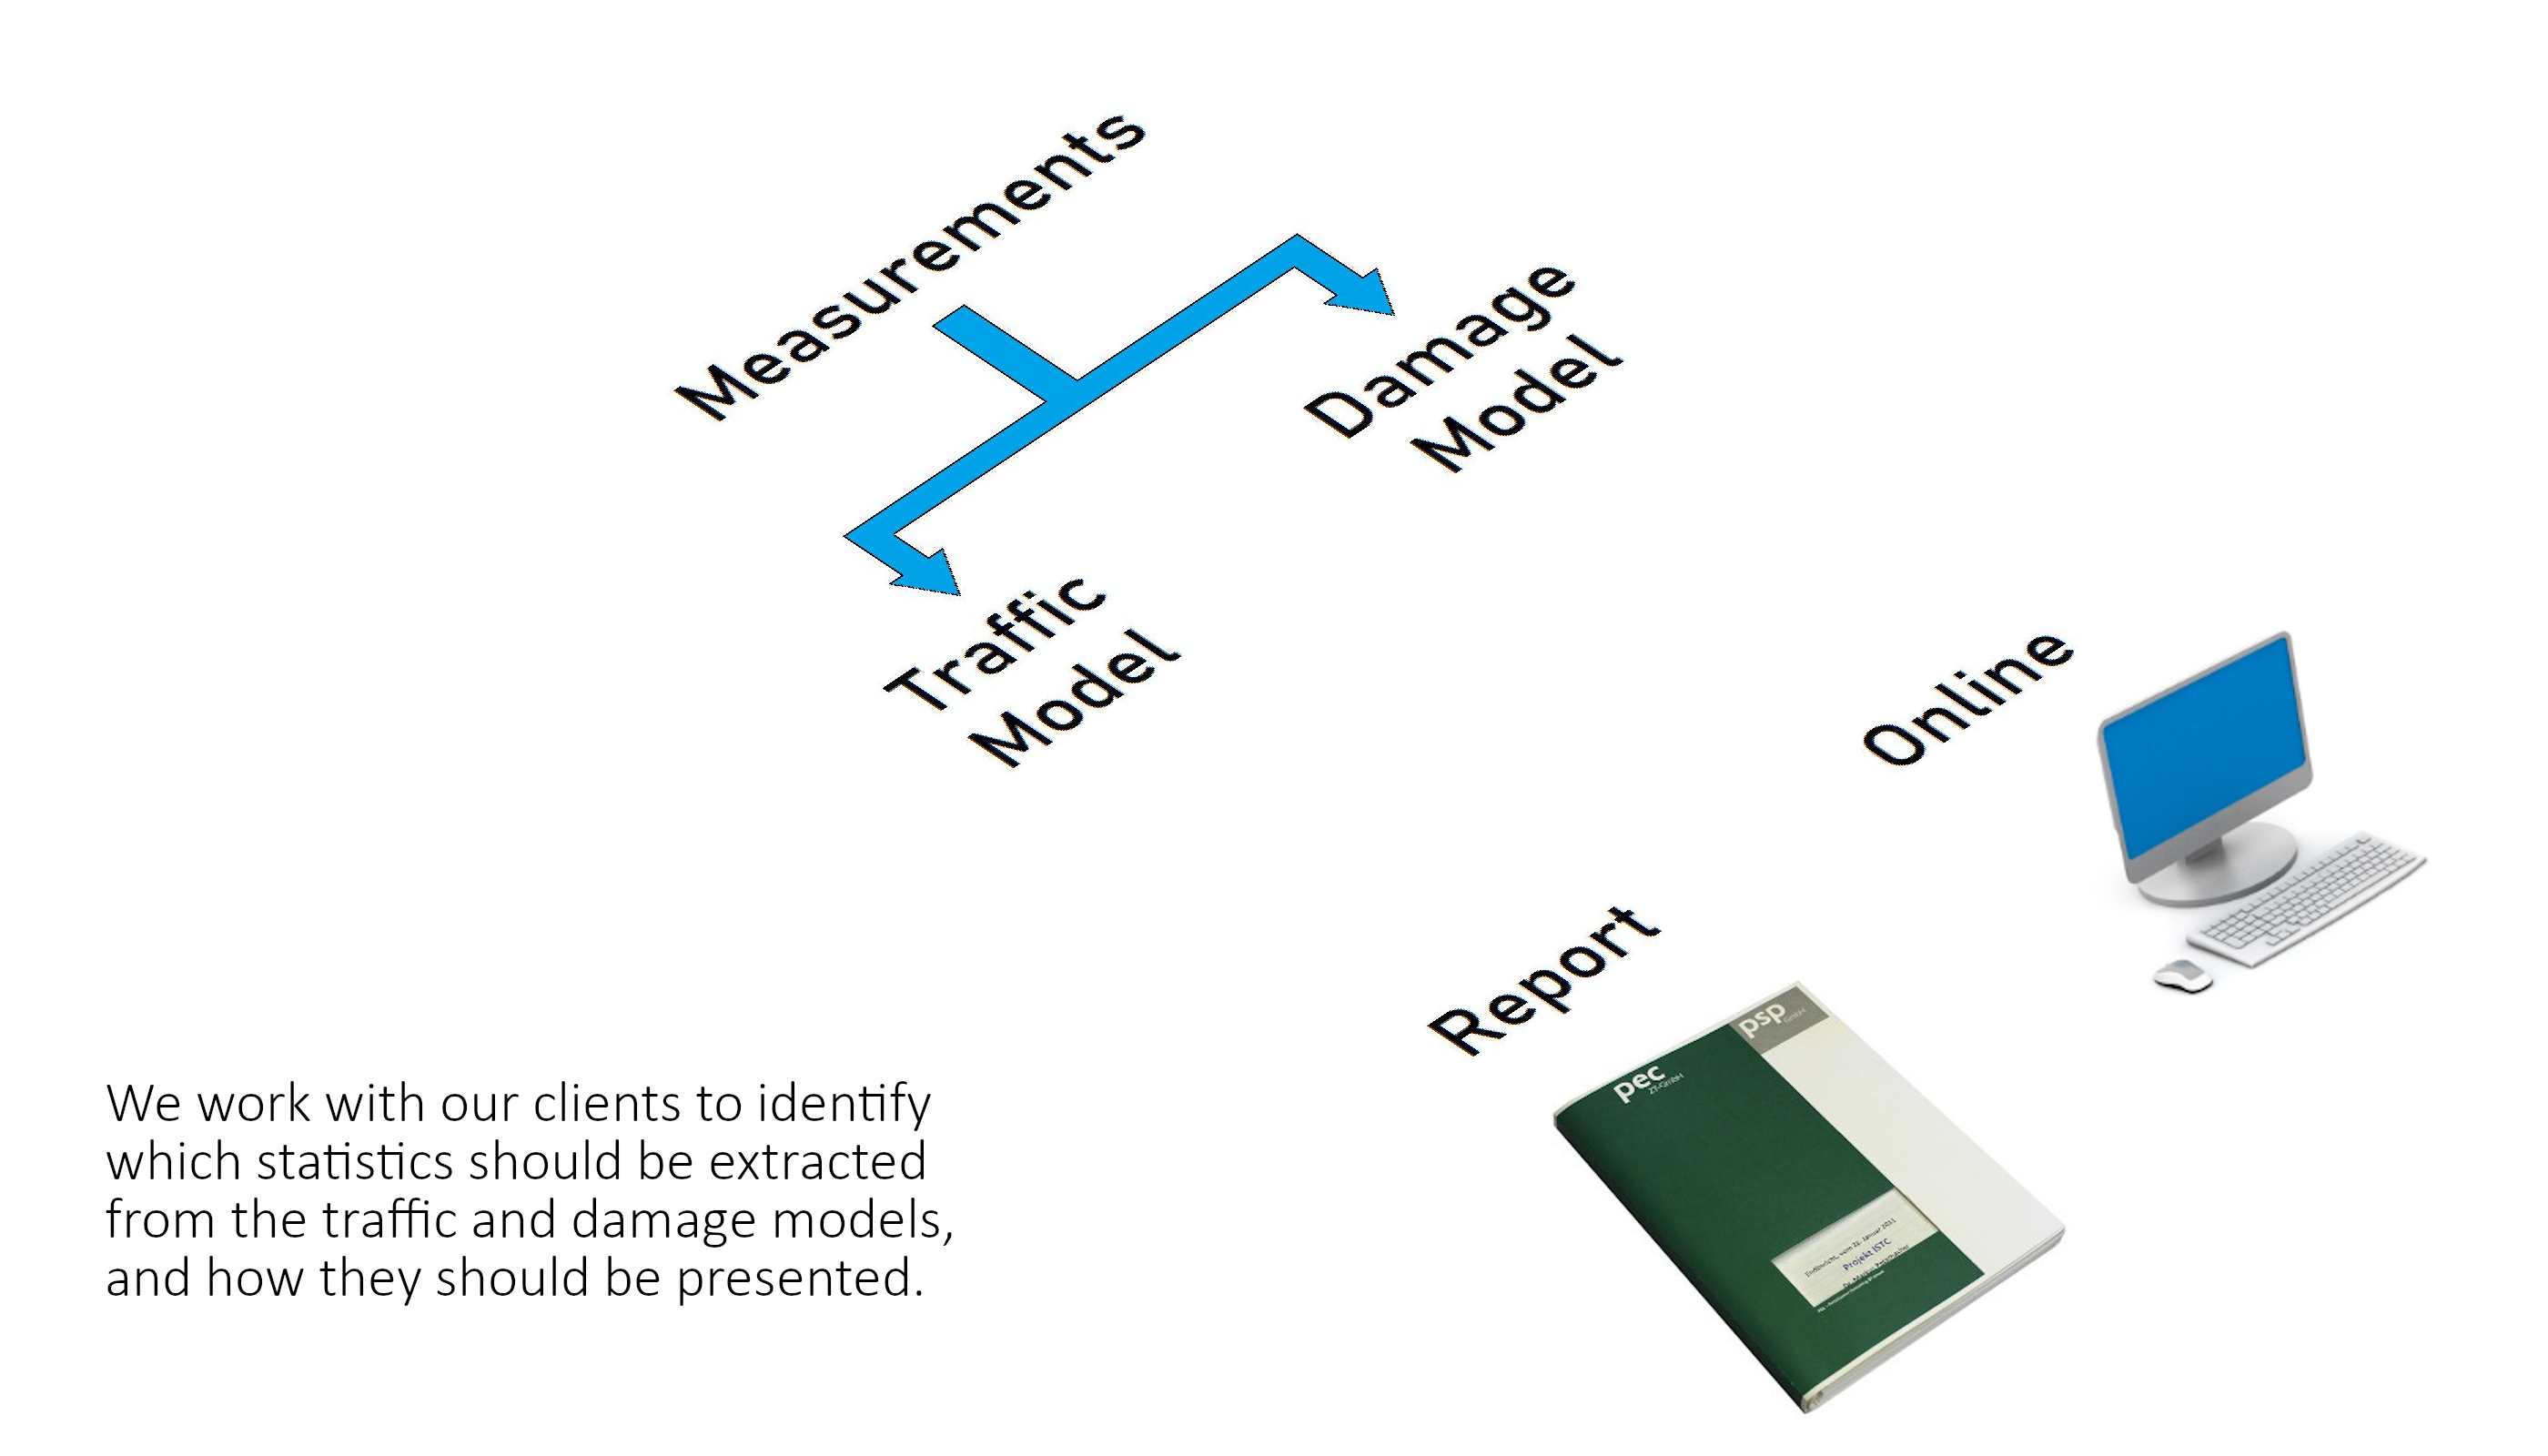
When a vehicle passes over a bridge an event is reported to the server. How the event is processed depends on primary concern whether the aim is to model traffic flow, or the damage caused by heavy goods traffic on the bridge.
If structural damage is the primary concern, the frequency and severity of axle impacts and bridge harmonics must be quantified. The cumulative effect of these impacts is integrated into the bridge damage model. This model may be expressed as a curve showing the predicted economic value of the bridge as a function of time. This gives managers a useful tool for assessing the cost and benefits of undertaking repairs at various stages in the bridge's evolution.
If traffic flow is the major concern, the strain signal is processed to extract a vehicle description, i.e. the vehicle's speed, weight and axle distribution. This is then added into the traffic model; a historical record of traffic crossing the bridge. The client can now view the current status of the bridge; a description of vehicles that have recently passed over the bridge; up to date traffic statistics and a short term prediction of traffic volume based on historical data and the current status.
iBWIM can either be purchased outright for permanent installation, or leased for a short measurement survey. The duration of a survey depends on the bridge traffic: to obtain statistically significant results, around fifty thousand vehicle transits should be observed. For a primary road the entire process requires ten days: an observation period of seven days plus one day each for installation, calibration and de-installation. Railways and secondary roads require observation periods of between one and two months. Once a significant data set has been amassed, it is processed and analysed at a remote server.
Whether it is used as a permanent measurement station, or for a short survey, iBWIM produces a large mass of data. PSP’s experience of BWIM systems and traffic modelling helps us extract useful information from this raw data set. We work with our clients to define what information is relevant to the client’s needs. We then tailor our data analytics to extract statistics that can be readily understood and actioned.
For instance, by collating diurnal and weekly statistics, the optimal times to conduct maintenance and impose traffic restrictions can be found. For bridge managers concerned about structural damage imposed by cyclic and exceptional loads, analysis can be conducted over longer timescales and restricted to particular classes of vehicle.
How the results are presented to our clients also varies from case to case. In some cases, clients require formal reports every six months: in other cases, clients prefer information about bridge traffic over the last 24 hours or week to be available online. Once again PSP will tailor our solution to our client’s needs.
The iBWIM system is an integrated approach to monitoring heavy goods traffic. It can be quickly installed by PSP without disrupting traffic flow. It does not need external power and only requires mobile network coverage. Data is analysed and presented on a remote server. The current status of the bridge traffic, its long term statistics can be viewed by the client online. The impact of traffic on the bridge's condition and depreciation can be modelled.